When your Mac starts running slow, it’s often due to processes hogging the Central Processing Unit (CPU). macOS provides a built-in tool, Activity Monitor, to help you identify and manage these resource-intensive processes. In this guide, we’ll explore how to use Activity Monitor to track down processes consuming the most CPU resources, with a focus on common culprits like Nsurlsessiond, Mdnsresponder, Hidd, Syslogd, Photoanalysisd, Gamecontrollerd, and ApplicationsStorageExtension.
What Is Activity Monitor in macOS?
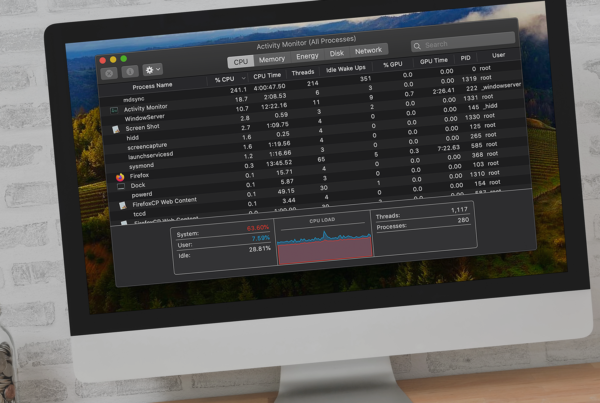
Activity Monitor is macOS’s equivalent of Task Manager on Windows. It provides real-time insights into CPU usage, memory consumption, energy impact, disk activity, and network usage. For technicians and power users, it’s the go-to tool for diagnosing performance issues caused by high CPU processes.
To open Activity Monitor:
- Press Command + Space to launch Spotlight Search.
- Type “Activity Monitor” and hit Enter.
- Navigate to the CPU tab to view processes sorted by CPU usage.
Why Do Some Processes Consume High CPU?
High CPU usage can stem from background tasks, system services, or third-party apps. While occasional spikes are normal, persistent high CPU usage may indicate a problem. Below, we’ll dive into seven macOS processes known to occasionally dominate CPU resources and how to spot them in Activity Monitor.
Common High CPU Processes in macOS
1. Nsurlsessiond: The Network Data Hog
- What it does: Nsurlsessiond handles network-related tasks for apps, such as downloading or uploading data in the background.
- Why it spikes: Large file syncs (e.g., iCloud Drive) or poorly optimized apps can overload this process.
- How to check: In Activity Monitor, look for Nsurlsessiond under the CPU tab. If it’s consistently above 50-70%, investigate active network tasks.
- Fix: Pause iCloud syncing or quit apps triggering excessive network activity.
2. Mdnsresponder: The Bonjour Service
- What it does: Mdnsresponder powers Bonjour, Apple’s zero-configuration networking protocol for device discovery (e.g., AirPrint, AirPlay).
- Why it spikes: Network congestion or misconfigured devices on your LAN can cause it to overwork.
- How to check: Sort Activity Monitor by “% CPU” and locate Mdnsresponder.
- Fix: Restart your router or disable unused Bonjour services via Terminal
sudo killall mDNSResponder.
3. Hidd: Human Interface Device Daemon
- What it does: Hidd manages input devices like your keyboard, mouse, or trackpad.
- Why it spikes: Faulty peripherals or driver conflicts can make Hidd go haywire.
- How to check: Watch for Hidd climbing the CPU usage chart in Activity Monitor.
- Fix: Disconnect external devices one-by-one or reset the SMC (System Management Controller).
4. Syslogd: System Logging Service
- What it does: Syslogd logs system events and errors for debugging.
- Why it spikes: Excessive error reporting from apps or hardware issues can flood the logs.
- How to check: In Activity Monitor, filter for Syslogd and monitor its CPU percentage.
- Fix: Check Console.app for error patterns and address the root cause (e.g., failing hardware).
5. Photoanalysisd: Photo Library Analyzer
- What it does: Photoanalysisd processes your Photos library for facial recognition and object detection.
- Why it spikes: After importing a large batch of photos or videos, it runs intensive analysis.
- How to check: Look for Photoanalysisd in Activity Monitor’s CPU tab—it can hit 100% during analysis.
- Fix: Pause analysis via Photos app (Preferences > General > Pause) or let it complete overnight.
6. Gamecontrollerd: Game Controller Support
- What it does: Gamecontrollerd enables support for game controllers in macOS.
- Why it spikes: Connected controllers or games with polling issues can drive up usage.
- How to check: Spot Gamecontrollerd in Activity Monitor under high CPU conditions.
- Fix: Disconnect controllers when not in use or update related drivers/software.
7. ApplicationsStorageExtension: App Management Daemon
- What it does: Manages app storage and extensions in macOS.
- Why it spikes: App updates or corrupted extensions can trigger high CPU usage.
- How to check: Search for ApplicationsStorageExtension in Activity Monitor’s CPU list.
- Fix: Restart your Mac or uninstall problematic apps/extensions.
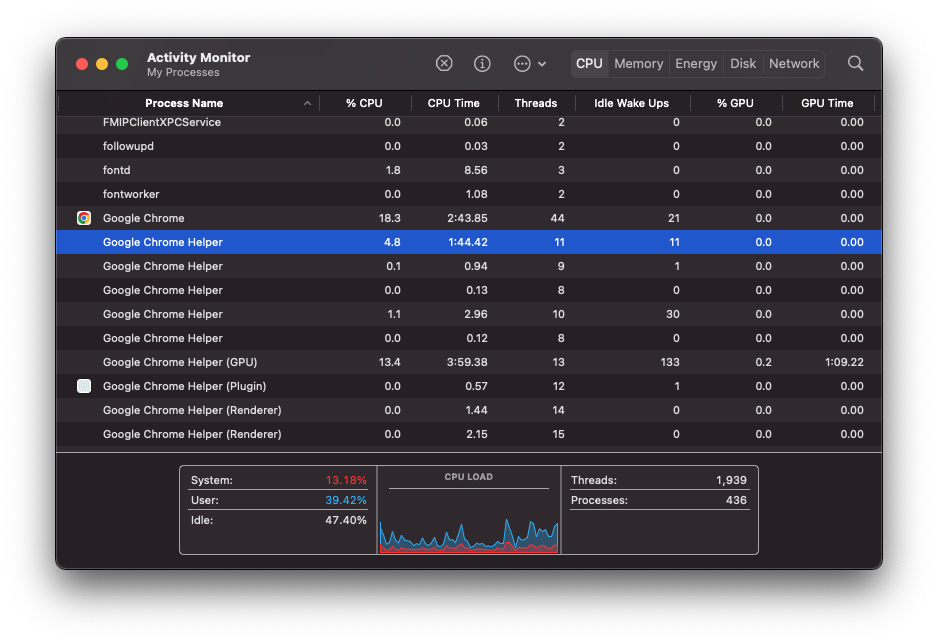
8. Google Chrome Helper (Renderer)
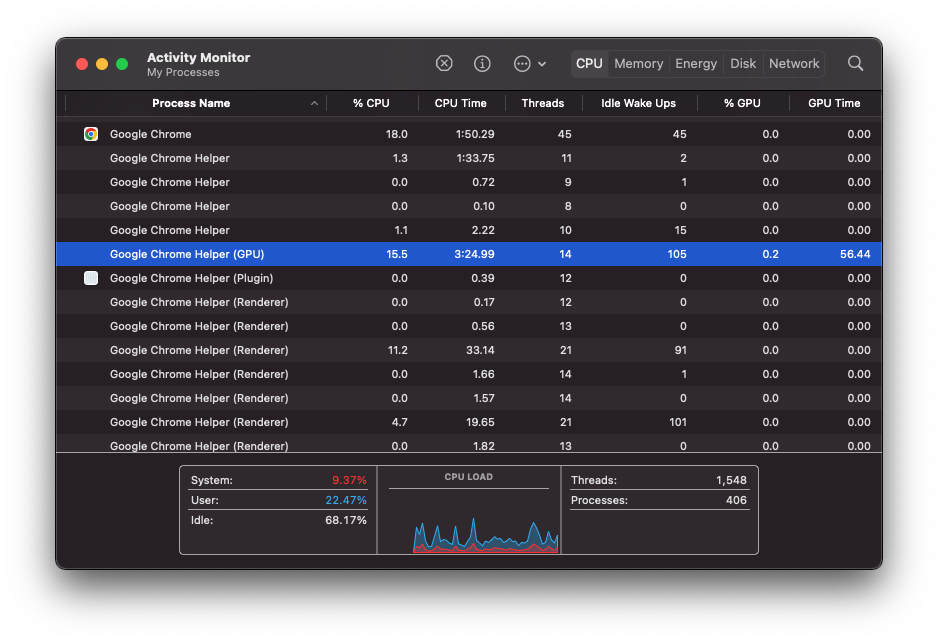
- What it does: Handles rendering of web pages and Chrome extensions.
- Why it spikes: Too many open tabs or extensions. Resource-heavy websites. Outdated Chrome version.
- How to check: Open Chrome Task Manager in in Google Chrome browser
Window > Task ManagerIdentify the “Renderer” processes with high CPU usage. - Fix: Close unnecessary tabs. Disable or remove problematic Chrome extensions
chrome://extensions/
– Update Chromechrome://settings/help
– Clear browsing datachrome://settings/clearBrowserData
– Disable Hardware Accelerationchrome://settings/system
– Toggle off “Use hardware acceleration when available”.
How to Use Activity Monitor to Troubleshoot High CPU Usage
- Sort by CPU Usage: Click the “% CPU” column header to list processes from highest to lowest usage.
- Filter Processes: Use the search bar (top-right) to find specific processes like Nsurlsessiond or Photoanalysisd.
- Inspect Details: Double-click a process for more info, including its parent app or service.
- Quit Processes: Select a process and click the “X” button to force quit (use caution with system processes).
Pro Tip: If a process restarts after quitting, it’s likely a system daemon. Address the underlying trigger instead.
When to Take Action
Occasional CPU spikes are normal, but if your Mac’s fans are constantly spinning or apps lag, it’s time to investigate. Processes like Mdnsresponder or Photoanalysisd may calm down after completing their tasks, but persistent offenders like Hidd or Syslogd could signal hardware or configuration issues.
Takeaways
Activity Monitor is your first line of defense against high CPU processes in macOS. By identifying resource hogs like Nsurlsessiond, Mdnsresponder, Hidd, Syslogd, Photoanalysisd, Gamecontrollerd, ApplicationsStorageExtension, and Google Chrome Helper, you can take targeted steps to restore performance. Whether it’s pausing iCloud syncs, disconnecting peripherals, or digging into system logs, this guide equips you to tackle CPU overuse like a pro.
For more macOS troubleshooting tips, bookmark this page and stay tuned for updates!